Why Is There a Growing Concern Over the Physical Fitness of Children and Adolescents?

Why is there a growing concern over the physical fitness of children and adolescents? Because the decline shows up in the measurements themselves, not only in adult impressions of how childhood used to look.
Tested aerobic fitness has fallen for decades across millions of children. About 4 in 5 adolescents worldwide miss the daily activity guideline, and US childhood obesity sits near 1 in 5, roughly triple its 1970s level.
This article separates the two variables the headlines merge, activity and fitness, labels every statistic with its population and year, and then walks the cause chain the evidence supports. It is general information about population trends, not advice about any individual child.
First, Separate the Two Variables
Most coverage of this topic fails at the first step. Activity and fitness are different measurements, and the concern is growing because both are falling at once.
Physical Activity Is a Behaviour
Activity counts movement: minutes of moderate to vigorous physical activity, days per week a child reaches 60 of them. Surveys, parent reports, and accelerometers all measure it, and each method returns a different percentage.
When a headline says most teenagers are inactive, it is describing behaviour against a guideline. It says nothing directly about what those teenagers’ bodies can do.
Physical Fitness Is an Outcome, in Components
Fitness measures capacity, in five health related components: cardiovascular endurance, muscular strength, muscular endurance, flexibility, and body composition.
It is tested, not surveyed: shuttle runs for aerobic capacity, grip and jump tests for muscular fitness, sit and reach for flexibility, BMI percentiles for body composition. Schools know it through FitnessGram and its healthy fitness zones.
Why the Concern Needs Both Numbers
A generation could move less yet stay fit, or move plenty in ways that never build capacity. The evidence shows neither escape is happening: the behaviour fell, and then the measured outcome fell behind it.
That double decline is the real answer to the question. Everything after this section is documentation.
The Evidence That Fitness Itself Has Fallen
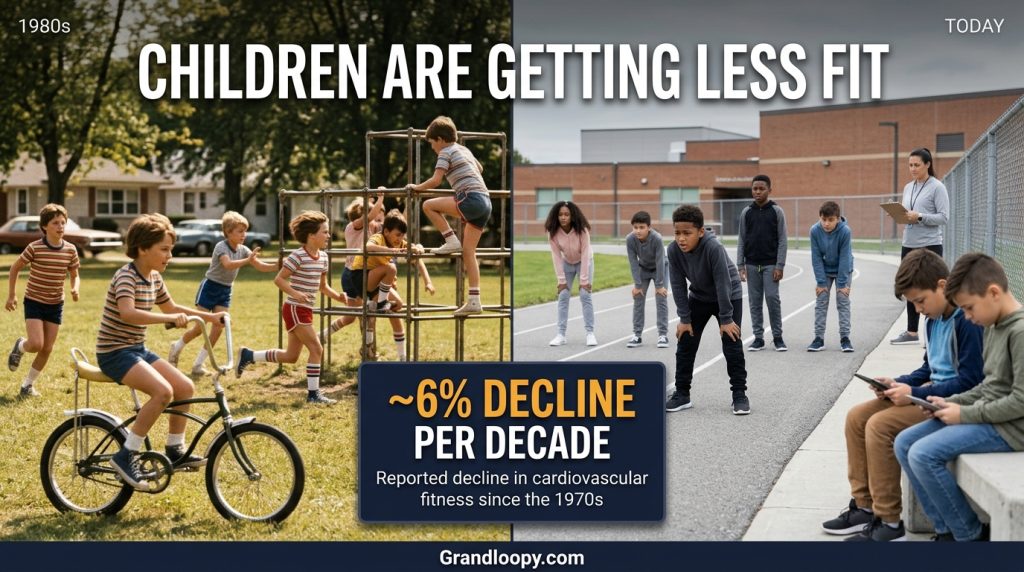
Start with the tests, because they answer the nostalgia objection. Children are not just playing differently; they perform worse on the same standardized efforts their predecessors took.
Aerobic Capacity: The Per Decade Decline
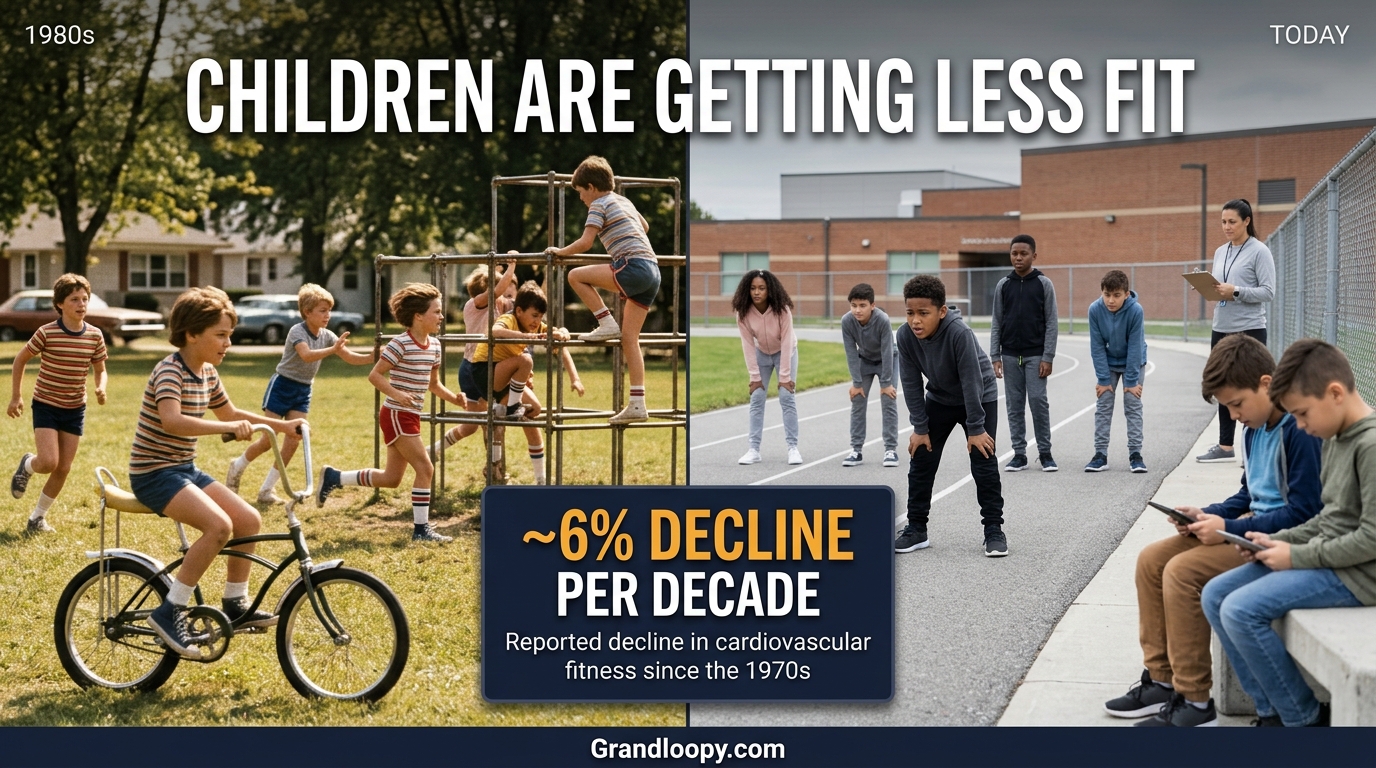
Secondary reporting attributes to the American Heart Association a fall in children’s cardiovascular fitness of about 6 percent per decade since the 1970s. This article prints it as an attributed strand, because the figure circulates through summaries rather than a single citable statement.
A 2013 analysis in the American Journal of Preventive Medicine, again as reported, put the 30 year decline at about 15 percent and translated it memorably: today’s children run roughly 90 seconds per mile slower than children in the 1980s.
The 25 Million Child Analyses
The scale underneath those strands is real. Analyses in the British Journal of Sports Medicine pooled more than 25 million children in 28 countries across the late twentieth century and found consistent declines in aerobic performance.
Different countries, different decades, different test batteries, the same direction. That consistency is why researchers treat the decline as a population fact rather than a measurement artifact.
Body Composition: The Obesity Trend Lines
The CDC’s own archive shows how long the weight line has been climbing. Its school health fact sheet reported adolescent obesity more than tripling from 5.0 to 17.6 percent between the 1980s and 2006.
Current CDC figures put obesity at about 19 percent of US children and adolescents aged 2 to 19, and a CDC journal analysis tracks the modern segment from 14.7 percent in 1999 to 19.2 percent in 2018.
Globally, the World Health Organization counts overweight at ages 5 to 19 rising from 8 percent in 1990 to 20 percent in 2022, over 390 million young people, including 160 million with obesity.
Muscular Fitness and Movement Competency
The decline is not only aerobic. Study batteries that test grip strength, standing long jump, and sit ups find modern children scoring below the cohorts of the 1980s in country after country.
Underneath the scores sits a quieter loss: fundamental movement skills, running, jumping, throwing, catching, developing less fully when childhood contains less unstructured movement to practise them in.
The Activity Numbers, Labelled by Population
Activity statistics cause the most confusion in this debate, because a global adolescent figure and a US child figure describe different worlds. Here they are, kept apart.
The Global Picture: The WHO Estimates
The WHO pooled analyses, published through The Lancet Global Health, find about 80 percent of adolescents worldwide fail to reach 60 minutes of moderate to vigorous activity daily.
The newest estimates, reported in November 2026, sharpen the picture with a harder metric. The news coverage is carried in the Mathrubhumi report on the WHO inactivity warning: 25 percent of 11 to 17 year olds reported zero active days in the previous week.
The same release puts the average at 2.7 active days per week, with only 14 percent meeting the guideline on all seven days, across surveys covering 3.2 million adolescents in 140 countries.
Extrapolated, the WHO estimates about 240 million adolescents worldwide get no qualifying activity in a week. Treat that number as an estimate built on the survey rate, not a headcount.
The United States Picture: CDC Surveillance
The CDC indicator page reports that 23.6 percent of US children aged 6 to 13 met the aerobic guideline in 2020 to 2021, under 1 in 4, from National Survey of Children’s Health data.
For adolescents, the same CDC indicator family puts guideline adherence at 16 percent on its measure. Older NHANES data for ages 12 to 15 found 24.8 percent reporting daily activity in 2012, a reminder that the survey and the year change the answer.
US activity is therefore better than the global adolescent average and still low in absolute terms. Both statements are true because the populations differ, which is the entire labelling lesson.
The Gender Gap That Appears in Every Dataset
Girls are less active than boys in nearly every country and dataset in this literature. In the newest WHO estimates, 28 percent of girls reported no active days, against 22 percent of boys.
A Norwegian survey quoted in the research found 17 to 20 percent of girls meeting recommendations against 28 to 31 percent of boys. The names and years change; the gap does not.
Researchers treat the gap as structural, not motivational: fewer pathways into sport, earlier dropout, and environments designed around boys’ preferences, a theme the 2026 Frontiers perspective on declining youth activity develops at length.
How the Measurement Works, and Why Methods Disagree

Fitness trends rest on field tests, because laboratories cannot test millions of children. The shuttle run estimates aerobic capacity from laps completed at a rising pace, and school systems repeat it year after year, which is what makes trend lines possible.
Activity figures vary more, because the instrument changes the answer. Self reported surveys flatter activity, parent reports sit in between, and accelerometer studies, which count movement directly, usually return the lowest adherence of all.
That is why two honest studies can report different percentages for the same country in the same year. The direction of travel agrees even when the instruments do not, and direction is what the concern is built on.
The Evidence Table: Every Figure With Its Label
This table is the article in miniature. Quote from it, and the label travels with the number.
|
Figure |
Population |
Source and year |
|---|---|---|
|
About 80 percent miss the daily guideline |
Adolescents, global |
WHO pooled analyses via Lancet Global Health |
|
25 percent had zero active days in a week |
Ages 11 to 17, 140 countries |
WHO estimates reported November 2026 |
|
23.6 percent met the aerobic guideline |
US children ages 6 to 13 |
CDC indicator page, 2020 to 2021 data |
|
About 19 percent have obesity |
US ages 2 to 19 |
CDC figures, current cycle |
|
Aerobic fitness down about 6 percent per decade |
Children, since the 1970s |
Strand attributed to the American Heart Association |
|
Overweight rose 8 percent to 20 percent |
Ages 5 to 19, global |
WHO, 1990 versus 2022 |
The Cause Chain
No single cause explains a fifty year trend. The evidence stacks causes that each removed movement from a child’s day, and they compound.
Screen Time and the Displacement of Play
The most cited mechanism is displacement: hours are finite, and hours given to television, phones, tablets, and games are hours not spent in active play.
Summaries put screen time at 4 to 6 hours daily for ages 8 to 12 and up to about 9 hours for teenagers. A large school study measured an average of 9.1 hours of total screen time in its sample; different populations, same direction.
The study evidence is graded rather than rhetorical: in the school fitness research, children exceeding screen guidelines performed worse on every fitness test, and the association strengthened step by step with screen exposure.
Physical Education and Recess, Cut in Plain Sight
Schools once guaranteed movement. Physical education has been cut for decades under budget pressure and the academic accountability shift toward tested subjects.
Advocacy summaries of the survey research put daily PE requirements at under 4 percent of elementary and middle schools and about 4 percent of high schools, with only about half of high school students attending any PE in a term.
Recess shrank alongside it. The irony the research keeps noting: CDC reviewed evidence finds added activity time does not lower grades, so the academic case for the cuts fails on its own terms.
The Disappearance of Unstructured Outdoor Play
Previous generations accumulated movement in unsupervised outdoor play: streets, yards, and open ground, for hours schools never scheduled.
Traffic, safety fears, smaller outdoor space, and fully scheduled childhoods moved play indoors and under supervision. Organized sport replaced some of it for some children; the total minutes never came back.
Sports Dropout in the Mid Teens
Organized sport was supposed to be the backstop, and it leaks at exactly the wrong age. The dropout drivers are named in the 2026 Frontiers perspective on declining youth activity: early specialization, competitive pressure, cost, and social disparities.
The pattern is consistent: sport becomes selective and expensive in the mid teens, and adolescents who are not thriving in it conclude they are not sporty and leave, taking their main structured activity with them.
Built Environment and Transport
Children move less when moving requires a car. Car based suburbs, distant schools, and missing sidewalks or safe cycling routes removed the incidental activity older childhoods contained by default.
The WHO’s own response points at the system: transport choices, recreational space, and safe walking and cycling routes are among the factors it names, ahead of individual encouragement.
The School Day, Then and Now
The structural story compresses into one comparison. A typical 1970s schoolchild walked or cycled to school, had daily PE and long recess, played outside unsupervised until dark, and had no screen smaller than a shared television.
A typical child today is driven, has PE once or twice a week where it survives, recess measured in minutes, supervised and scheduled afternoons, and a personal screen that follows them to bed.
Nothing in that comparison requires nostalgia to work. It is an activity budget: the modern day simply contains fewer minutes in which movement can happen, and the fitness data is the predictable result.
Inequality: Sex, Income, and Rurality
The burden is not evenly shared. Beyond the gender gap, lower income youth are less active and drop out of paid sport faster, because pay to play prices them out first.
Geography cuts too. The geographic evidence sits in the CDC journal study of rural and urban obesogenic behaviours, which analysed the National Survey of Children’s Health.
It found rural children had higher odds of overweight or obesity than urban children, adjusted odds ratio 1.36, even though they were not more inactive, a result that points at food environment and access as well as movement.
The Pandemic Disruption
The pandemic years removed PE, recess, and organized sport at once, while screen time rose, and several cohorts show accelerated weight gain in that window.
Treat it as an accelerant, not the origin: the trend lines in this article were falling for four decades before 2020.
The Strength Question Nobody Asked a Generation Ago
Muscular fitness deserves its own paragraph because it breaks the weight only framing. Children can sit in a healthy weight range and still post grip and jump results well below historical cohorts.
Strength and power underpin the skills sport and play are built from. When they fall, children find physical activity less rewarding, attempt less of it, and the activity decline and the fitness decline start driving each other.
Why It Matters: The Consequences
Concern grows when a trend carries consequences beyond itself. This one compounds, biologically and institutionally.
Risk Factors Arriving in Childhood
The conditions inactivity predicts are no longer waiting for adulthood. Elevated blood pressure, cholesterol abnormalities, insulin resistance, and early onset type 2 diabetes are documented in children and adolescents today.
Fatty liver disease and sleep and mental health problems sit in the same picture. Childhood is when these trajectories set, which is why pediatric organizations treat the trend as urgent rather than cosmetic.
The Tracking Problem
Childhood obesity and inactivity strongly predict their adult versions; that is the consistent finding of the longitudinal literature the CDC’s materials summarize.
Layer the feedback loop on top: in the NHANES data, adolescents with obesity were the least likely to be active daily, 18.0 percent among boys in that category, so the children most at risk move the least, and the gap widens itself.
Mental Health, Cognition, and School Performance
The adolescent side of this is covered in the 2026 Frontiers perspective on declining youth activity: inactivity is tied to weaker self efficacy and worse mental health, while sports participation is linked to better physical and mental outcomes.
The school evidence runs the same direction. Fitness and activity are associated with cognition and academic performance, which is the practical rebuttal when activity time is traded for test preparation.
Costs: Healthcare, Readiness, and Opportunity
Inactive children become adults with higher chronic disease risk, and the healthcare system inherits the bill. The concern also reached national policy through a side door: military readiness.
Retired military leaders report that poor physical fitness is one of the leading reasons young Americans fail enlistment standards. When a health trend starts closing institutional doors, the audience for it stops being only parents and doctors.
A Note on the Adult End of the Same System
The concern in this article is often discussed as if it ends at eighteen. It does not: the tracking evidence means today’s school fitness data is a preview of the adult population’s health, gym habits, and healthcare demand.
That is the level at which GrandLoopy’s readers usually meet the topic, comparing facilities and routines for themselves. The children’s data explains why the adult system is straining: each cohort arrives starting from a lower fitness base than the one before.
What the Evidence Supports Doing
The response literature converges on a principle: rebuild movement into the structures that removed it, rather than exhorting children to try harder inside unchanged days.
In Schools: Activity Across the Day
The comprehensive model, CSPAP, spreads activity across PE, recess, classroom breaks, and before and after school, instead of betting everything on one weekly lesson.
The integration case is argued in the 2026 Frontiers perspective on declining youth activity: physical activity built into education rather than traded against it. The grades evidence removes the standard objection.
Fitness testing belongs in this section too, used as feedback for students and programs, the FitnessGram design intent, rather than as a public ranking that teaches unfit children to dread the lesson.
In Families: Screens, Sleep, and Play
The family levers in the guidance are unglamorous: recreational screen limits, regular sleep, daily active time, and active transport where it is safe.
The 24 hour framework ties them together, and the PLOS One study of fitness and 24 hour movement guidelines shows why: in its elementary school sample, children meeting the activity guideline scored higher across the fitness battery, with screen and sleep adherence adding to, not replacing, that effect.
In Communities: Routes, Parks, and Affordable Sport
The community levers are the WHO’s list made local: safe routes to school, usable parks and playgrounds, and sport priced so the mid teen dropout is a choice rather than an eviction.
GrandLoopy’s own fitness shelf sits at the adult end of this system.
Family membership decisions get easier to judge with the facility facts in our explainer on whether Planet Fitness has a sauna and our guide to Planet Fitness showers, and recovery fads get a calmer reading in our explainer on Total Body Enhancement at Planet Fitness.
The Homework Answer Versus the Evidence
Because this question circulates as an assignment, short answer pages rank for it, and their summaries are worth reading critically. They typically name the right causes, screens, PE cuts, obesity, but they strip every figure of its dataset and year.
A claim like obesity has tripled is defensible only with its endpoints attached. The moment a number loses its population, a global adolescent rate and a US child rate become interchangeable, and the answer starts misleading the student who copies it.
What Has Not Worked at Scale Yet
Honesty requires the last word to be the WHO’s: fifteen years with almost no global improvement, despite universal agreement on the guideline.
Campaigns aimed at individual motivation have not moved the population line. The interventions with evidence behind them change schedules, spaces, and prices, which is slower, less photogenic, and the actual frontier.
Reading the Answer Sites Critically: A Worked Check
One widely copied summary of this topic states that childhood obesity has tripled and fitness has declined by 15 percent, in a single sentence. Both halves can be defended, but only with four labels attached: which country, which ages, which years, and which dataset.
Run that check on any paragraph about this topic, including this article’s. A figure that survives it is evidence; a figure that cannot say where it came from is decoration, and decoration is how the concern gets exaggerated in one retelling and dismissed in the next.
Frequently Asked Questions
1. Why is there a growing concern over the physical fitness of children and adolescents?
Because the decline is measured, not remembered. Tested aerobic fitness has fallen for decades, about 4 in 5 adolescents worldwide miss the daily activity guideline, and childhood obesity has roughly tripled in the US since the 1970s.
All in named datasets.
2. Are children today really less fit than previous generations?
Yes, on the test evidence. Large analyses pooling more than 25 million children across 28 countries found consistent declines in aerobic performance.
And secondary reporting attributes about a 6 percent per decade fall in cardiovascular fitness to the American Heart Association.
3. What is the difference between physical activity and physical fitness?
Activity is a behaviour; fitness is an outcome. Activity counts minutes of movement.
Fitness measures what the body can do: aerobic capacity, muscular strength and endurance, flexibility, and body composition.
A child can be busy and still test unfit, which is why the concern tracks both.
4. How is children’s physical fitness measured?
Mostly with field tests. The 20 meter shuttle run (the PACER) estimates aerobic capacity, grip and jump tests measure muscular fitness, sit and reach measures flexibility, and BMI percentiles describe body composition.
FitnessGram compares results with age and sex specific healthy fitness zones.
5. What percentage of adolescents meet the 60 minute activity guideline?
Globally, about 1 in 5. The WHO pooled analyses find roughly 80 percent of adolescents miss the 60 minute daily guideline.
The newest estimates add that only 14 percent met it on all seven days of the surveyed week.
6. What percentage of US children meet the physical activity guideline?
About 1 in 4 younger children. The CDC indicator page reports 23.6 percent of US children aged 6 to 13 met the aerobic guideline in 2020 to 2021.
Adolescent figures run lower, 16 percent on the CDC indicator measure.
7. How much has children’s cardiovascular fitness declined?
By roughly 6 percent per decade since the 1970s, in the attributed strand. A 2013 analysis put the 30 year decline at about 15 percent, children running roughly 90 seconds per mile slower than 1980s children.
Both are reported strands, not direct journal quotes.
8. What does the latest WHO data say about teenage activity?
It got worse on the newest metric. The Lancet Global Health estimates reported in November 2026 found 25 percent of 11 to 17 year olds had zero active days in the previous week, across 140 countries and 3.2 million adolescents.
The WHO warns progress stalled for 15 years.
9. What is a zero active day and how many adolescents have them?
It is a day with no 60 minute bout of moderate to vigorous activity. A quarter of adolescents reported a full week of them in the latest WHO estimates, about 240 million extrapolated globally.
Girls reported more zero days than boys, 28 versus 22 percent.
10. Why are girls less physically active than boys?
The gap appears in nearly every dataset, for structural reasons. Girls face fewer pathways into sport, earlier dropout pressure, safety and cultural constraints, and provision designed around boys’ preferences.
In the newest WHO data, 28 percent of girls versus 22 percent of boys had no active days.
11. How many children and adolescents have obesity in the United States?
About 1 in 5. CDC figures put obesity at roughly 19 percent of US children and adolescents aged 2 to 19.
A CDC journal strand tracks the rise from 14.7 percent in 1999 to 19.2 percent in 2018.
12. Has childhood obesity really tripled since the 1970s?
In direction, yes, and the CDC’s own archive shows it. A CDC fact sheet reported adolescent obesity more than tripling from 5.0 to 17.6 percent between the 1980s and 2006 alone.
Current figures sit near 19 percent, so tripled is a fair summary of the full period.
13. Is screen time the main cause of declining youth fitness?
It is the most cited single mechanism, not the only one. Screen time displaces active play, and studies link heavier screen use with weaker fitness test results.
But PE cuts, lost outdoor play, sports dropout, and car based environments each removed movement independently.
14. How much screen time do children and teenagers average?
Several hours a day, by any dataset. Summaries put ages 8 to 12 at 4 to 6 hours daily and teenagers at up to about 9.
One large school study measured 9.1 hours of total screen time in its sample.
Populations differ, so the figures are never merged.
15. Why has physical education been cut in so many schools?
Budgets and testing pressure did it. Districts cut PE minutes to protect examined subjects and save money, a shift tied to the accountability era.
PE went from daily to weekly or optional in many schools, though CDC reviewed evidence says added activity does not lower grades.
16. How many schools still require daily PE?
Very few. Advocacy summaries of survey research put daily PE requirements at under 4 percent of elementary and middle schools and about 4 percent of high schools.
Only about half of high school students attend any PE class at all in a given term.
17. What happened to unstructured outdoor play?
It was designed out of the day. Traffic, safety fears, smaller yards, scheduled childhoods, and screens moved play indoors and under supervision.
Earlier generations accumulated hours of movement in unsupervised outdoor play that structured sport and PE never replaced minute for minute.
18. Why do so many teenagers quit sports in their mid teens?
Cost, pressure, and narrowing. The Frontiers perspective lists the drivers: early specialization, competitive pressure, rising costs, and social disparities.
Sport becomes selective and expensive exactly when adolescents are deciding whether they are sporty, and many conclude they are not.
19. Does early specialization cause sports dropout?
It is a named contributor. Year round single sport training raises cost, injury, and burnout, and consensus statements from pediatric and sports medicine bodies advise delaying it.
Dropout research lists early specialization among the pressures that push mid teens out.
20. How does being unfit in childhood affect adult health?
Through tracking and early risk. Childhood obesity and inactivity strongly predict their adult versions, and risk factors once seen only in adults, raised blood pressure, cholesterol problems, insulin resistance, now appear in children.
The habits and the physiology both carry forward.
21. Can an unfit child become a fit adult?
**Yes.
Fitness is trainable at every age.** The tracking evidence describes probability, not destiny: active interventions improve children’s test results within a school year in the intervention literature.
What tracks most stubbornly is the environment, which is changeable.
22. What health problems are appearing earlier because of youth inactivity?
The list is arriving earlier than it used to. Elevated blood pressure, abnormal cholesterol, insulin resistance, early onset type 2 diabetes, fatty liver disease, and sleep and mental health problems are all documented in inactive youth populations.
In general information terms.
23. Does physical activity affect school grades?
The evidence points the other way. CDC reviewed research finds more school activity time does not reduce academic performance, and fitness and activity are associated with better cognition and classroom behaviour.
That is why the PE cuts are contested even on academic grounds.
24. What is the connection between youth fitness and military readiness?
Unfit youth narrow the eligible pool. Military leaders’ groups report that poor physical fitness is one of the leading reasons young Americans fail enlistment standards.
That moved the topic from health pages into readiness policy, which is part of why the concern keeps growing.
25. Did the pandemic make children’s fitness worse?
The disruption is documented; the size varies by study. Closures removed PE, recess, and organized sport while screen time rose, and weight gain accelerated in several cohorts.
This article treats the pandemic as an accelerant layered on a decades long trend, not as the trend’s cause.
26. What are the components of physical fitness in children?
Five, in the standard model. Cardiovascular endurance, muscular strength, muscular endurance, flexibility, and body composition make up health related fitness.
School batteries test them with shuttle runs, grip and jump tests, sit and reach, and BMI measures.
27. What is the PACER test and FitnessGram?
The PACER is the 20 meter shuttle run used in FitnessGram testing. Children run back and forth at a rising pace, and laps completed estimate aerobic capacity.
FitnessGram, run by the Cooper Institute, compares scores with criterion referenced healthy fitness zones by age and sex.
28. What are the 24 hour movement guidelines?
They combine the whole day. Frameworks used in Canada, Australia, and research studies set targets together: at least 60 minutes of MVPA, no more than 2 hours of recreational screen time, and age appropriate sleep.
In the Japanese study, meeting the activity target was what separated fitter children.
29. Why do different studies report different activity percentages?
Method and population, mostly. Self reported surveys, parent reports, and accelerometer studies produce different adherence rates, and a global adolescent pool is not a US child sample.
That is why this article labels every figure with its population, dataset, and year instead of picking one.
30. Are rural children less fit than urban children?
On weight, the CDC data says yes. In the National Survey of Children’s Health 2021 to 2022, rural children had higher odds of overweight or obesity, adjusted odds ratio 1.36.
The same study found rural children were not more inactive, so access and food environment matter.
31. Do active video games count toward children’s fitness?
Partly, and the research is honest about the limits. Active games raise energy expenditure above sitting and can add light to moderate activity.
They do not reproduce the intensity, outdoor time, or movement variety of active play, so researchers treat them as a supplement, not a substitute.
32. Is strength training safe for children and adolescents?
The pediatric consensus says yes, when supervised and technique led. Age appropriate resistance training is considered safe and beneficial by pediatric and sports medicine bodies.
The cautions are about maximal loads, poor form, and unsupervised lifting, not about strength training itself.
33. How much exercise do children and teenagers actually need?
Sixty minutes a day of moderate to vigorous activity for ages 6 to 17. That is the US Physical Activity Guidelines standard, with muscle and bone strengthening activity on at least three days a week.
Younger children need more unstructured active play through the day.
34. What role does sleep play in children’s fitness?
Sleep is the third leg of the movement day. Short sleep is associated with higher obesity odds in the survey data, and tired children move less.
The 24 hour guideline frameworks treat activity, screens, and sleep as one system for exactly that reason.
35. Can schools add activity time without hurting test scores?
The CDC reviewed evidence says yes. Studies of added PE and activity time find no downturn in grades, and some find gains in attention and behaviour.
The trade off districts assumed, activity time versus academic time, does not show up in the results.
36. What is the displacement hypothesis?
It is the idea that screen hours replace active hours. Time is finite, so hours given to television, phones, and games are hours not spent in play or sport.
It is the most cited mechanism in this literature, though researchers note screens also displace sleep.
37. Why has global adolescent activity barely improved in 15 years?
Because the drivers are structural and the fixes have been small. The WHO’s own summary is blunt: 15 years with almost no improvement, and girls left furthest behind.
Campaigns asked individuals to change while environments, school schedules, and costs stayed the same.
38. What can parents do about a child’s fitness, in general terms?
In general terms: protect the hour, the play, and the sleep. Families in the guidance literature focus on daily active time, recreational screen limits, regular sleep, and active transport where safe.
Anything specific to one child’s health belongs in a conversation with their clinician.
39. What can schools do to improve student fitness?
The evidence supports activity across the whole day. Daily PE, protected recess, movement breaks, and active lessons, the CSPAP model, rather than one weekly lesson.
Schools using fitness testing as feedback rather than punishment also see better engagement in the program literature.
40. Is this concern only about weight?
No, and the fitness data proves it. Shuttle run and strength results have fallen in analyses that include children across weight categories, and muscular fitness and movement competency have declined alongside aerobic capacity.
Weight is one component of fitness, not a synonym for it.
41. What is the single most important statistic on youth fitness?
For the concern itself: tested fitness falling across generations. If one figure must carry it, use the labelled pair: aerobic fitness down about 6 percent per decade since the 1970s (attributed strand).
With about 80 percent of adolescents missing the daily activity guideline globally (WHO).
42. Where can I check the original data behind these claims?
Start with the primaries linked on this page. The WHO estimates via The Lancet Global Health, the CDC indicator definitions and journal studies, and the Frontiers perspective.
Each figure here names its dataset so you can find the original table.
Conclusion
Why is there a growing concern over the physical fitness of children and adolescents?
Because the decline is measured in the tests themselves, the causes are built into the modern school day and the modern street, and fifteen years of monitoring have not yet bent the curve.
The hopeful fact sits in the same evidence: fitness responds at any starting point, and the systems that removed movement, school, family, and community, are the same systems that can put it back.
Read the figures on this page with their labels attached, and the concern stops sounding like nostalgia. It reads as what it is: a solvable structural problem with a generation’s health as the stake. The wider shelf starts at the GrandLoopy home page.